Overview
At AusNet, we believe in a decarbonised energy future. Distributed energy resources (DER), like community batteries, are a key piece of this puzzle. But these resources require planning and an understanding of the network.
At AusNet, we believe in a decarbonised energy future. Distributed energy resources (DER), like community batteries, are a key piece of this puzzle. But these resources require planning and an understanding of the network.

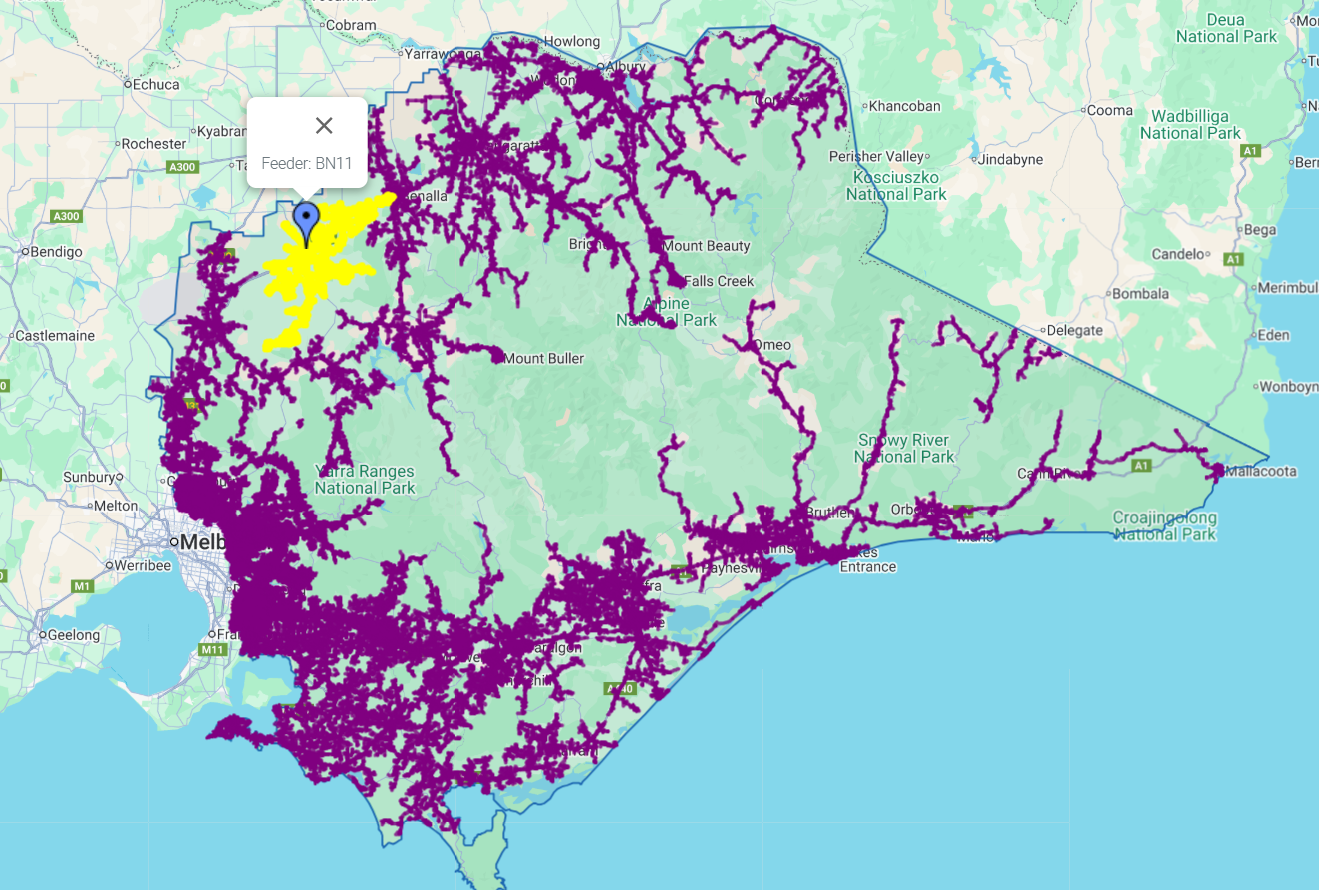
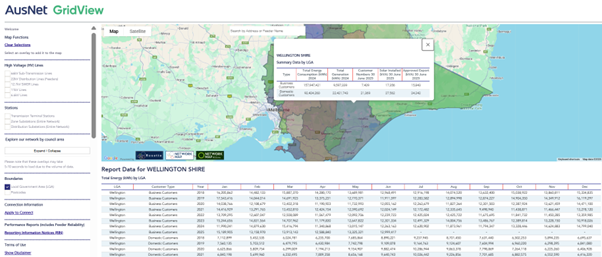
We partnered with Rosetta Analytics to create GridView. This portal:
We have established the GridView Improvement Group (GIG), a collaborative forum to guide the ongoing development of GridView. The GIG brings together community energy advocates, council representatives, technical experts and our staff to make sure GridView continues to support the transition to a renewable energy future.
Our latest September GridView update features refreshed data as of 30 June 2025. We've introduced several enhancements to make it easier for customers and communities to explore and understand our network:


